Phipps Stories

#bioPGH Blog: Rain, Rain and More Rain!
 A resource of Biophilia: Pittsburgh, #bioPGH is a weekly blog and social media series that aims to encourage both children and adults to reconnect with nature and enjoy what each of our distinctive seasons has to offer.
If it seems like Pittsburgh has been a rainy place this year, you are correct! Historically, Pittsburgh annually receives 38 inches of precipitation per year, but we surpassed that mark as August rolled into September. As of this post going live, we have currently received 47.41 inches of rain in 2019, and the weather forecast hints at more this weekend. Last year, we broke the city record for total annual precipitation by closing out 2018 with 57.83 inches—could we meet that mark again this year? And why are we seeing increasingly more rain in the state? Let’s dig into this wet weather!
According to the last hundred years of precipitation, Pennsylvania receives more rain now than it used to. In fact, in the last 50 years, Pennsylvanians saw an average of 44.3 inches of precipitation per year; but in the 50 years before that, though, we saw an average of 40.9 inches per year. You can check out the last century of precipitation in the graph below.
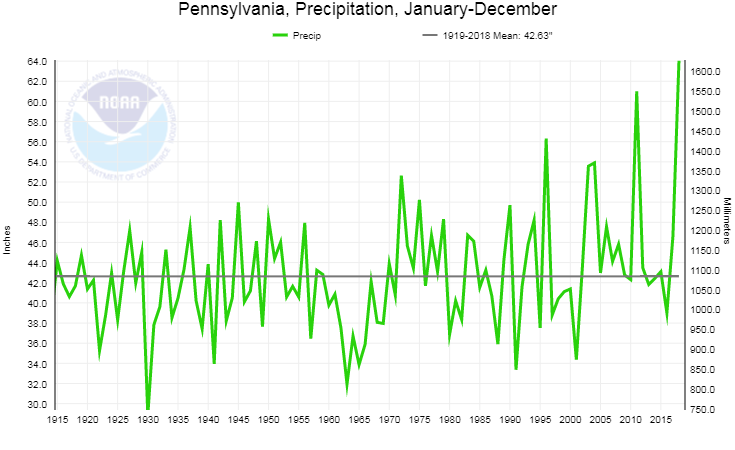
This graph was created through NOAA’s Climate at a Glance feature. I set the parameter to look at total precipitation over 12-month periods from 1919-2019 (data is only displayed through 2018; inches are shown on the left, millimeters on the right.)
Pittsburgh, like the rest of Pennsylvania, has experienced increasing rainfall as our climate slowly warms, and we do seem to be on track for another year of record or near-record rainfall. At first, we might wonder why that is, but the wetter weather seems to be somehow correlated with our warmer temperatures, as you can see in the graph below.
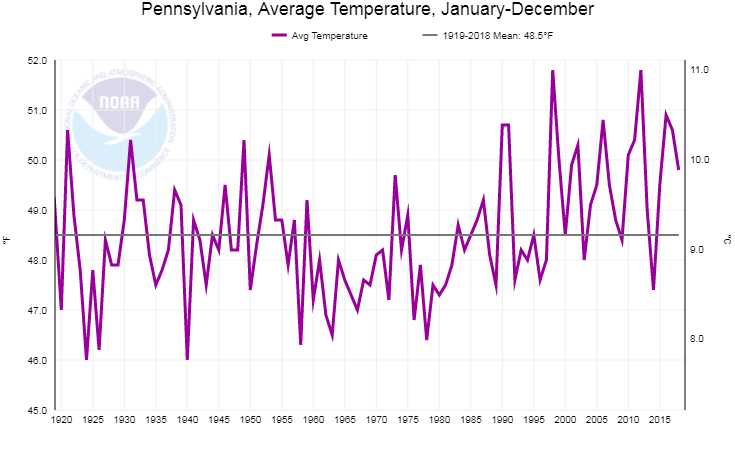
This graph was created through NOAA’s Climate at a Glance feature. I set the parameter to look at average temperature over 12-month periods from 1919-2019 (data is only displayed through 2018; Fahrenheit temperatures are marked on the left, Celsius on the right.)
The graph above shows our average annual statewide temperatures from 1919 -2018, and the line in the middle of the graph shows the overall average for this time period. Like the rest of our home planet, Pennsylvania is slowly but surely warming. As you can note in the data, over the last 30 years, we have spent more time above that average line than below it and our high temperature years are warmer than they were in the first half of the 20th century. I should also mention –a swing of a few degrees may not seem to be a major concern, but only an average difference of 14 degrees Fahrenheit separates Pennsylvania’s temperate climate from the subtropical climate of South Carolina (48.5°F versus 62.7°F).
To summarize, global climate change is impacting our own local climate, and the increase in temperature is impacting our area by increasing annual precipitation. So to bring this discussion back to our original question: if it has felt like Pittsburgh has been wetter for the past few years, you are absolutely correct. Superficially, this might seem helpful as it decreases the likelihood of drought conditions, but it can also be detrimental for our city built into hillsides since a wetter climate increases the possibility of landslides. Also, the PA DCNR climate adaptation and mitigation plan has a list of vulnerabilities and how the state is planning to deal with them.
It is also important to note that an increase in rainfall alongside an increase in temperature is not universal. Climate patterns like precipitation are controlled by a variety of factors, not just temperature—topography, proximity to a jet stream or ocean, latitude and other factors all play a role. In Zimbabwe, for example, the increasing temperatures have cut their annual rainfall in half; and last year, Australia experienced record heat and drought conditions as their existing hot and dry climate is exacerbated by rising global temperatures.
This can all certainly seem overwhelming, but luckily, we all have the power to start tackling climate change right now! The best starting point is to learn about climate change as much as possible from trustworthy sources. At home, you can start by making small changes that have a big impact on climate. You can also have a major impact by talking about the issue—speak up on social media, bring it up in community meetings, and keep it in conversation. A huge thing you can do, too, is be a voice of encouragement. When you see someone taking action, let them know you see it and applaud them. We all could use a reminder that we’re not alone, and to reference the great Pittsburgher, Mr. Rogers, we all need a good neighbor. So let’s all be good neighbors and make sure the next generation has a home as wonderful as ours!
While we are on the subject, I wanted to share a quick reminder that climate and weather are two very different things. Climate is the long-term, predictable set of conditions (such as temperature, humidity, rainfall, etc.) that one might expect in a given area throughout the course of the year. Weather, on the other hand, is what we actually experience day-to-day and hour-by-hour. Put another way: climate is thinking of what you would pack in your suitcase to visit Florida in July versus Maine in January. Weather is the outfit you pick to wear on a given day during that trip.
Connecting to the Outdoors Tip: You don’t have to be a scientist to record data! If you have the space for a rain gauge, you can keep one outside your home and measure rainfall yourself. Or, you can find a USGS rain gauge near you and keep track of data from somewhere nearby.
Continue the Conversation: Share your nature discoveries with our community by posting to Twitter and Instagram with hashtag #bioPGH, and R.S.V.P. to attend our next Biophilia: Pittsburgh meeting.
Photo credits: Header and cover public domain, Pexels


